
GoWind IoT Product Introduction
GoWind IoT is an IoT device management and analytics platform built on a Go microservices architecture: from device access, video surveillance, and telemetry storage to a rule engine, alert handling, OTA operations, and data dashboards, it covers the complete chain of IoT project delivery. The platform is closed-source commercial and multi-tenant, delivered on-premise, with all data kept in the customer's own environment.
Whether you are a device manufacturer, a system integrator, or an industry customer, one platform handles "unified device access, unified data governance, and unified business orchestration", compressing project delivery time from months to weeks.
1. Core Highlights
1. Device Access
Tips
"Zero-credential power-on" means field installers no longer need to prepare credentials for every device in advance: once a device is powered and connected, it registers and activates automatically — thousand-device rollouts no longer require per-device key provisioning.
- MQTT access + product-level dynamic registration: devices power on with zero credentials and register/activate automatically — no per-device key flashing, saving time on bulk deployments;
- Downlink commands + receipt state machine: after a command is issued, its full lifecycle is tracked through "sent → delivered → executed" states — no more guessing about execution results;
- Message-level tracing: every device message can be queried for its complete processing trail, giving field troubleshooting solid evidence;
- Industrial protocols: supports OPC-UA and Modbus TCP, connecting directly to PLCs and industrial gateways.
2. Video Surveillance
Tips
Video is linked with alerting: when an alert fires, a snapshot is captured automatically and a short event clip is retained, closing the loop between surveillance and evidence collection within one platform.
- Multi-protocol camera access: unified access and management for RTSP / GB28181 / ONVIF cameras;
- Real-time live view: RTSP-first with sub-second latency, plus HLS / WebRTC playback for web and mobile viewing;
- Recording archive and playback: recordings are archived as MP4 for on-demand review of past footage;
- Video wall: a 2x2 split-screen video wall monitors multiple feeds at once;
- Automatic alert evidence: snapshots are captured automatically when alerts fire, and a 10-second event clip is retained, so field conditions are clear at a glance;
- Playback token anti-leeching: video playback uses a token mechanism to prevent link misuse.
3. Telemetry and Time-Series Data
- Dual storage: latest device values and historical data are stored separately — current status queryable in milliseconds, long-term trends traceable for years;
- Real-time push: data changes are pushed to the UI in real time via SSE, with zero polling — what the page shows is exactly what the device is reporting now;
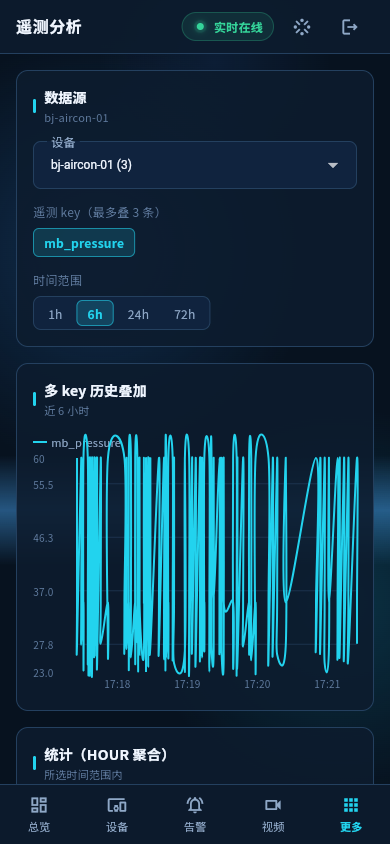
- Trend charts: telemetry trend charts work out of the box; curves for temperature, humidity, voltage, current, and more are one click away.
4. Rule Engine
- Visual rule chain designer: drag-and-drop orchestration of data-processing flows with multi-branch support and script nodes — business staff can get started right away;
- Debug workbench: simulate and validate rules before they go live — no more "blind changes";
- Rich processing capabilities: built-in processing units for geofence checks, time-window aggregation, sub-chain reuse, and more;
- Execution history and message replay: the rule execution history of every message is queryable, and historical messages can be replayed for verification — problem locating no longer relies on guesswork.
5. Alerts
Tips
Alerts are not "flash and gone": every alert carries a complete lifecycle record of acknowledgment and clearing, so afterwards you can review who handled which alert and when.
- State machine management: alerts flow through the "triggered → acknowledged → cleared" state machine, making ownership of handling clear;
- Context panel: alert details come with field snapshots and short video clips — no more switching systems to confirm the situation on site;
- Duty view: pop-up reminders on the duty console keep critical alerts from being missed.
6. Geofencing
Tips
Fence areas take effect the moment they are drawn on the map, and entry/exit alerts fire automatically — no coding required.
- Visual editor: draw fence areas directly on the map based on GeoJSON;
- Entry/exit alerts: automatic alerts when vehicles, personnel, or devices enter or leave a fence — suitable for fleet supervision, asset guarding, and similar scenarios.
7. OTA and Device Operations
- Upgrade package management: firmware/software upgrade packages managed in one place; create batch upgrade tasks and push them in stages;
- Device groups: group devices by region, business line, and other dimensions for targeted batch operations;
- Device shadow + drift records: maintain a desired state for every device; differences between actual and desired state (drift) are recorded automatically;
- Device simulator: simulate device connections and reporting without hardware, validating business flows in advance.
8. Data Dashboards
Tips
Dashboards are configured by business staff with drag-and-drop, no front-end development required; a redesign only means adjusting the designer, and the new screen can go live the same day.
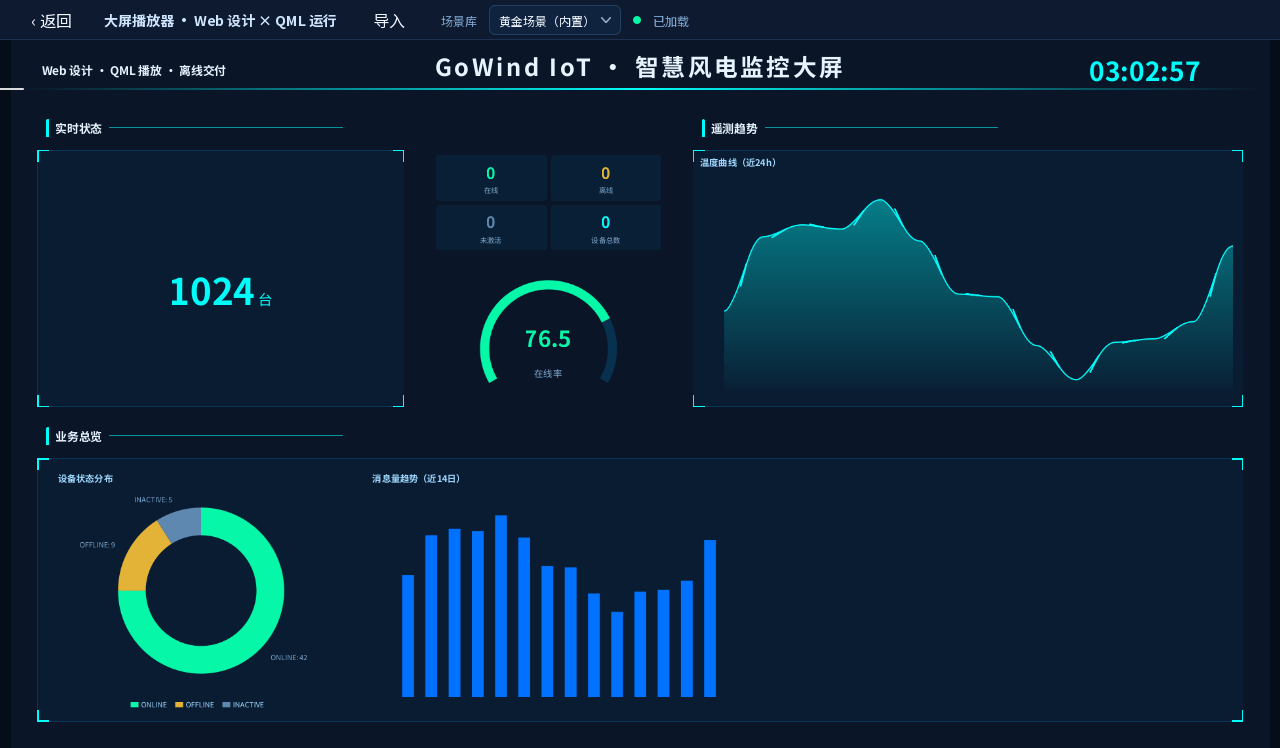
- Configuration-based designer: 51 built-in components — drag, drop, and configure to build monitoring dashboards with no development;
- Template library and themes: common dashboard templates and themes work out of the box for a fast start;
- Sharing and screen casting: share dashboard links or cast directly from the browser; offline export is supported for archiving and display.
9. AI and Reports
- AI weekly report automation: device operation reports are generated automatically every week — no more manual data gathering for ops reviews;
- Report center: common operational reports managed in one place;
- Data insights: aggregate analytics over device data to surface operating patterns and anomalies.
10. Notifications
- Multi-channel reach: email, SMS, Telegram, DingTalk, WeCom (Enterprise WeChat), Feishu (Lark), and other channels;
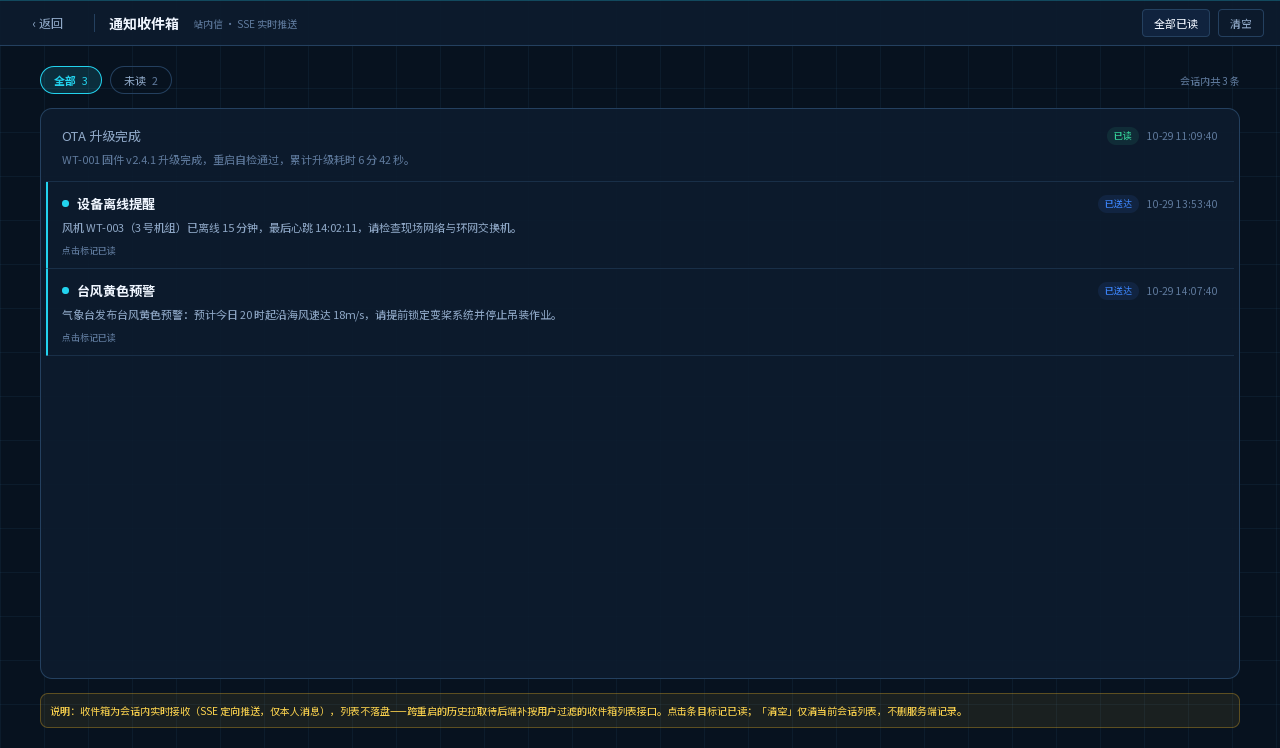
- Unified inbox: in-site messages and desktop notifications converge in one inbox, so alerts and notices are reviewed in one place.
11. Platform Capabilities
- Multi-tenancy: group subsidiaries and integrator projects can operate in isolation, invisible to one another;
- MFA multi-factor authentication: logins support multi-factor verification for security and compliance;
- Six categories of audit logs: key operations are logged by category to satisfy internal-control reviews;
- Multilingual UI: the interface switches between Chinese, English, and Japanese.
2. Applicable Scenarios
| Scenario | How platform capabilities are used |
|---|---|
| Environmental monitoring | Real-time telemetry curves, threshold alerts, historical trend review, combined with data dashboards for external display |
| Campus / industrial-park security | Unified GB28181 / ONVIF camera access, video wall duty, automatic alert snapshots for evidence |
| Smart wind / solar power | Device telemetry aggregation, automatic rule-engine decisions, dashboards cast to the command center |
| Fleet / asset supervision | Geofence entry/exit alerts; device shadows show the actual state of every device |
| Bulk device delivery and operations | Zero-credential dynamic registration that works on power-up, OTA batch upgrades, and simulator validation of flows in advance |
All of these scenarios are configured with standard platform capabilities — no custom development required.
3. Client Form Factors
| Form | Description |
|---|---|
| Web management console | Device management, rule configuration, alert handling, and dashboard building all from the browser |
| Qt6 desktop console | Dark console styling suited to monitoring duty; supports a dashboard Kiosk carousel mode for always-on display |
| Flutter mobile / desktop client | One codebase compiled for iOS / Android / Web / macOS / Windows / Linux, with dark console styling shared with the Qt6 console; SSE real-time push keeps alerts and telemetry at hand on the go |
| Web dashboard casting | Data dashboards cast straight from the browser to command-center / exhibition-hall screens |
4. UI Preview
The following are actual screenshots of the Qt6 desktop console:
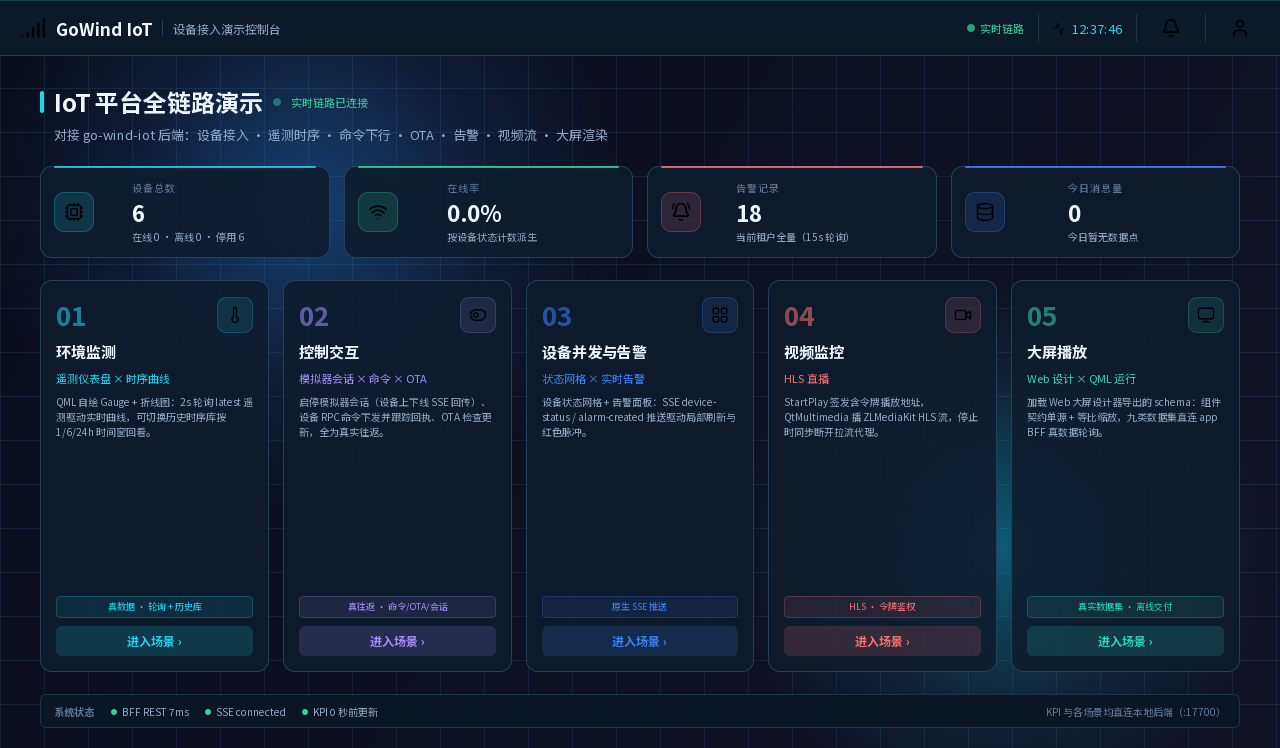 | 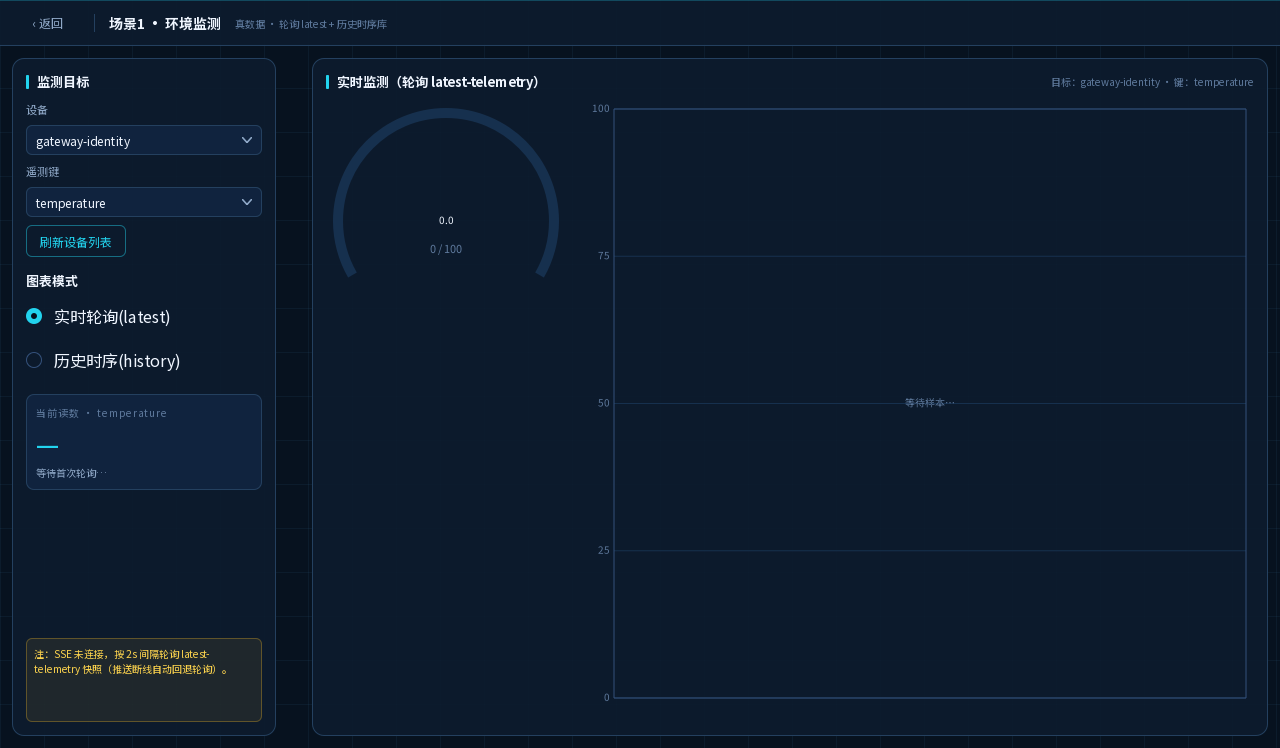 |
|---|---|
| Full-chain demo home | Environmental monitoring: real-time telemetry curves |
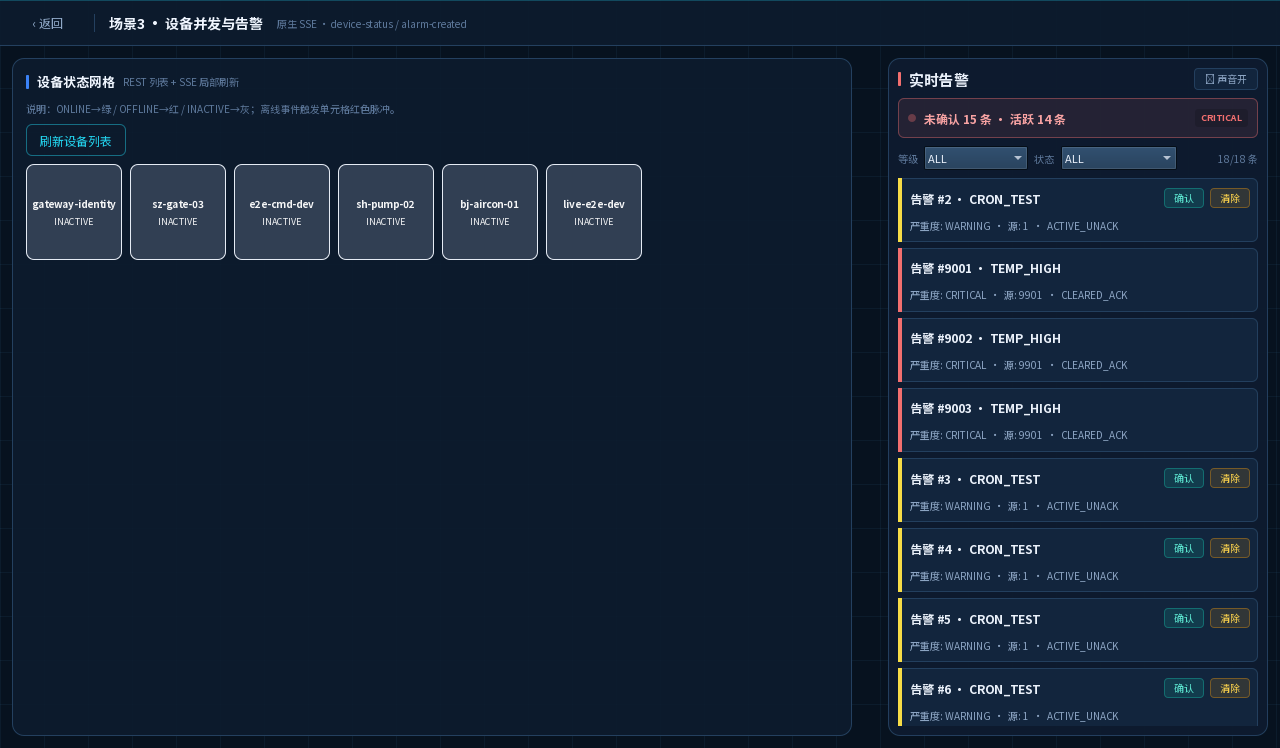 | 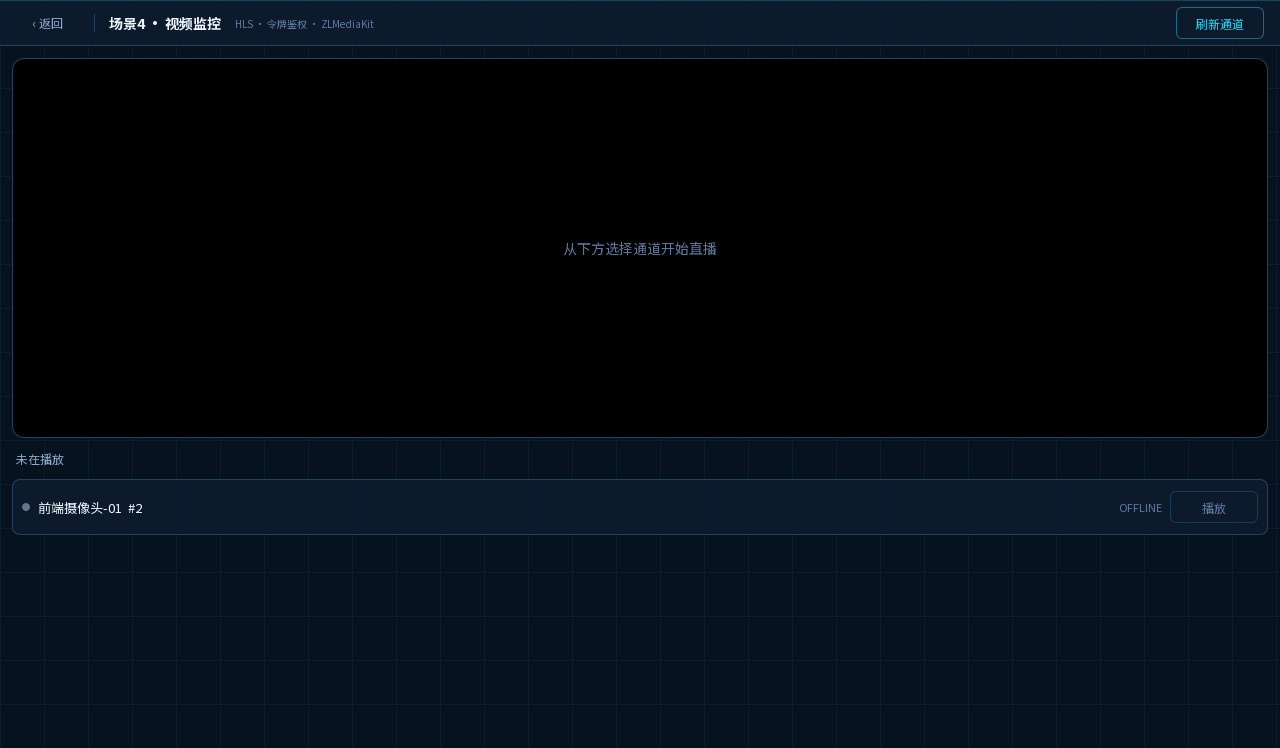 |
|---|---|
| Concurrent device alert monitoring | Video surveillance: live multi-feed viewing |
 |  |
|---|---|
| Smart wind power data dashboard | Notification inbox |
Flutter Mobile Client
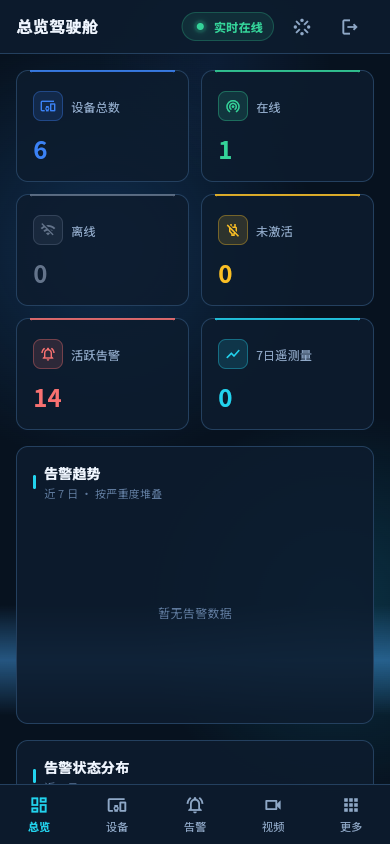
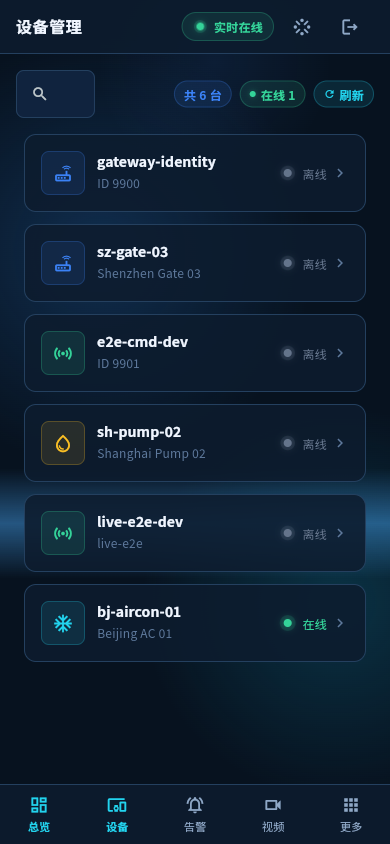
The overview cockpit, telemetry analysis, and device management travel with you — alerts and telemetry are pushed in real time over SSE, so field duty no longer means staring at a big screen:
 |  |
|---|---|
| Overview cockpit: device online status and active alerts on one screen | Telemetry analysis: multi-key overlaid history curves |
 | |
|---|---|
| Device management: online status visible in real time |
5. Deployment and Delivery
- On-premise delivery: the platform is delivered in full to the customer's own servers or private cloud — data never leaves the customer's environment;
- One-command infrastructure with Docker Compose: databases, messaging, and other infrastructure start with one command, lowering the deployment barrier;
- Edge installation scripts: installation scripts are provided for edge-side deployment, so field engineers can complete installation following the documentation.
6. Contact Us
GoWind IoT is a closed-source commercial product. To learn about feature demos, solution evaluations, and commercial licensing, please contact:
- WeChat:
yang_lin_bo(please include the note: Company-Name-IoT needs) - Email: yanglinbo@gmail.com
For more deployment details, see the GoWind IoT Installation and Deployment Guide.